
This report provides the last five years revenues and revenue growth of Illumina Inc (ILMN) from 2012 to 2016. Illumina generated a total of $2.4 billion revenues during 2016. Illumina reported a revenue growth of 8% year-over-year during 2016. The revenues and the revenue growth correspond to the fiscal year ending in December.
Illumina Revenues from 2012 to 2016
Here are the revenues and the revenue growth details of Illumina during the last five years:
- Illumina generated a total of $1.1 billion revenues during 2012. Illumina reported a revenue growth of 8.8% year-over-year during 2012.
- Illumina generated a total of $1.4 billion revenues during 2013. Illumina reported a revenue growth of 23.7% year-over-year during 2013.
- Illumina generated a total of $1.9 billion revenues during 2014. Illumina reported a revenue growth of 31% year-over-year during 2014.
- Illumina generated a total of $2.2 billion revenues during 2015. Illumina reported a revenue growth of 19.3% year-over-year during 2015.
- Illumina generated a total of $2.4 billion revenues during 2016. Illumina reported a revenue growth of 8% year-over-year during 2016.
Why Analyze Revenue Growth?
Revenue growth is the most commonly analyzed financial metric. Revenue Growth is the percent increase (or decrease) of a company’s revenue between two time periods. It is computed by using the following formula: ((revenues during the time period two – revenues during the time period one) / revenues during the time period one)*100. If the time periods are two consecutive years, then the revenue growth is referred to as the annual revenue growth year-over-year. If the time periods are two consecutive quarters, then the revenue growth is referred to as the quarterly revenue growth quarter-over-quarter. If the time periods refer to the same quarter in the two consecutive years, then the revenue growth is referred to as quarterly revenue growth year-over-year. In case the time periods are two non-consecutive years, then the revenue CAGR (Commutative Annual Growth Rate) is computed.
Revenue growth analysis is important for a number of reasons. First, it helps in understanding how a business is performing. If the revenue growth rates are positive, it means the business is performing well and the revenues are increasing. If the revenue growth rates are negative, it means the revenues are declining and the company needs to take measures to increase them. If they don’t, the company will continue to shrink. Second, a company’s historical revenue growth analysis along with the market size and market share analysis helps in forecasting the future revenues of a company. Third, a comparison of a company’s growth rates with its competitors helps in determining who is winning more business. A revenue growth higher than the industry average translates into increasing market share. Companies with very high revenue growth rates have the potential to be the industry disrupters.
Illumina Ranking
With $2.4 billion revenues, Illumina ranked number 849 in the R&P; Research list of top-3000 public companies in the US by revenues during 2016. Each one of the top-3000 companies generated more than $50 million of annual revenues during 2016.
The top-20 companies in the US by revenues during 2016 were:
- Walmart ($482.1 billion)
- ExxonMobil ($226.1 billion)
- Berkshire Hathaway ($223.6 billion)
- Apple ($215.6 billion)
- McKesson ($190.9 billion)
- UnitedHealth Group ($184.8 billion)
- CVS Health ($177.5 billion)
- General Motors ($166.4 billion)
- AT&T; ($163.8 billion)
- Ford Motor ($151.8 billion)
- AmerisourceBergen ($146.8 billion)
- Amazon ($136 billion)
- Verizon ($126 billion)
- General Electric ($123.7 billion)
- Cardinal Health ($121.5 billion)
- Costco ($118.7 billion)
- Walgreens Boots Alliance ($117.4 billion)
- Chevron ($114.5 billion)
- Kroger ($109.8 billion)
- Express Scripts Holding ($100.3 billion)
For the purpose of performance benchmarking of a company with a sector or industry average, R&P; Research associates every company with one sector and one industry. An industry consists of companies with related/similar business models. A sector comprises of a group of related/similar industries. For high-level analysis purposes, related/similar sectors are grouped into sector groups.
For example, Healthcare sector group is comprised of Life Sciences sector and Healthcare Services sector. Life Sciences sector is comprised of following industries: Pharmaceuticals; Medical Devices; Biotechnology; Diagnostics & Scientific Instruments. Healthcare Services sector is comprised of following industries: Medication Stores, PBM and Distributors; Healthcare Payers; Healthcare Providers; Medical Software; Healthcare Research Services.
Illumina is associated with Healthcare Sector Group, Life Sciences Sector and Diagnostics & Scientific Instruments Industry.
With $2.4 billion revenues, Illumina ranked number 78 of all the companies in the US Healthcare sector group. There were a total of 290 public companies in the US Healthcare sector group that had revenues greater than $50 million during 2016.
The top-10 companies in the US Healthcare sector group by revenues during 2016 were:
- McKesson ($190.9 billion)
- UnitedHealth Group ($184.8 billion)
- CVS Health ($177.5 billion)
- AmerisourceBergen ($146.8 billion)
- Cardinal Health ($121.5 billion)
- Walgreens Boots Alliance ($117.4 billion)
- Express Scripts Holding ($100.3 billion)
- Anthem ($84.9 billion)
- J&J; ($71.9 billion)
- Aetna ($63.2 billion)

Healthcare sector group is comprised of the following sectors: Life Sciences; Healthcare Services.
With $2.4 billion revenues, Illumina ranked number 38 of all the companies in the US Life Sciences sector. There were a total of 197 public companies in the US Life Sciences sector that had revenues greater than $50 million during 2016.
The top-10 companies in the US Life Sciences sector by revenues during 2016 were:
- J&J; ($71.9 billion)
- Pfizer ($52.8 billion)
- Merck ($39.8 billion)
- Gilead Sciences ($30.4 billion)
- Medtronic ($28.8 billion)
- Abbvie ($25.6 billion)
- Amgen ($23 billion)
- Eli Lilly ($21.2 billion)
- Abbott Laboratories ($20.9 billion)
- Bristol Myers Squibb ($19.4 billion)
Life Sciences sector is comprised of the following industries: Pharmaceuticals; Medical Devices; Biotechnology; Diagnostics & Scientific Instruments. The definitions for each of the industries is as follows:
- Pharmaceuticals industry includes companies that discover, develop, manufacture, and market medicines licensed for use as medications. In general these companies offer pharmaceutical products that can be described as prescription or over-the-counter medicines. Many Pharmaceutical companies also offer a diverse portfolio of animal health products, services and solutions. Many diversified pharmaceutical companies operate in more than two operating segments like consumer health products, medical devices and pharmaceutical.
- Medical Devices industry includes manufacturers and distributors of medical equipments and medical supplies. Medical equipments include large scale capital equipmets such as X-Ray machines and MRI scanners and other nondisposable medical devices like stents and pacemakers. Medical supplies include makers of contact lenses, eyeglass lenses, bandages and other disposable products.
- Biotechnology industry includes Biotechnology product companies, subscription companies, and service companies. Biotechnology product companies offer pharmaceutical medication products that are manufactured in, extracted from, or semi synthesized from biological sources. Subscription-based companies develop genome databases, which can be used to develop medicinal medications. Service companies offer solutions based on a common technology or generic tool of other large pharmaceutical or biopharmaceutical companies.
- Diagnostics & Scientific Instruments industry includes companies that provide testing products, diagnostic reagents, instruments and diagnostic services to aid in the detection and treatment of a wide range of diseases. It also includes molecular diagnostic and genetic testing companies that develop, manufacture, market and provide diagnostic tests, diagnostic systems and related products and services. Also included are companies that manufacture and market analytical instruments, equipment, reagents and consumables, software and services for research, manufacturing, analysis, discovery and diagnostics.
With $2.4 billion revenues, Illumina ranked number 6 of all the companies in the US Diagnostics & Scientific Instruments industry. There were a total of 22 public companies in the US Diagnostics & Scientific Instruments industry that had revenues greater than $50 million during 2016.

The top-10 companies in the US Diagnostics & Scientific Instruments industry by revenues during 2016 were:
- Thermo Fisher Scientific ($18.3 billion)
- Quest Diagnostics ($7.5 billion)
- Agilent Technologies ($4.2 billion)
- Hologic ($2.8 billion)
- Mettler Toledo ($2.5 billion)
- Illumina ($2.4 billion)
- Waters ($2.2 billion)
- PerkinElmer ($2.1 billion)
- Bio-Rad ($2.1 billion)
- OPKO Health ($1.2 billion)
Companies Segmentation
To identify and analyze high/low growth or most/least profitable similar-size companies in different sectors or industries, R&P; research classifies all companies into different segments based upon their revenues, revenue growth, and net profit margins.
Based upon their annual revenues, the companies are classified into one of the following four segments:
- Mega companies, having revenues greater than $50 billion.
- Very Large companies, having revenues between $10 billion and $50 billion.
- Large companies, having revenues between $1 billion and $10 billion.
- Mid-size companies, having revenues between $50 million and $1 billion.
With $2.4 billion revenues, Illumina was in the Large companies revenue segment during 2016. There were a total of 1097 companies in the Large companies revenue segment during 2016.
Based upon their annual revenue growth, the companies are classified into one of the following eight segments:
- Very High positive growth companies, having annual revenue growth greater than 50%.
- High positive growth companies, having annual revenue growth between 20% and 50%.
- Medium positive growth companies, having annual revenue growth between 5% and 20%.
- Low positive growth companies, having annual revenue growth between 0% and 5%.
- Low negative growth companies, having annual revenue growth between -5% and 0%.
- Medium negative growth companies, having annual revenue growth between -20% and -5%.
- High negative growth companies, having annual revenue growth between -50% and -20%.
- Very High negative growth companies, having annual revenue growth less than -50%.
With 8% revenue growth year-over-year, Illumina was in the Medium positive revenue growth segment during 2016. There were a total of 876 companies in the Medium positive revenue growth segment during 2016. Of the US top-3000 companies, 1985 (nearly two-third of the total) had positive revenue growth and 1015 (nearly one-third of the total) had negative revenue growth during 2016.
Based upon their annual net profit margin, the companies are classified into one of the following eight segments:
- Very High positive margin companies, having net profit margin greater than 50%.
- High positive margin companies, having net profit margin between 20% and 50%.
- Medium positive margin companies, having net profit margin between 5% and 20%.
- Low positive margin companies, having net profit margin between 0% and 5%.
- Low negative margin companies, having net profit margin between -5% and 0%.
- Medium negative margin companies, having net profit margin between -20% and -5%.
- High negative margin companies, having net profit margin between -50% and -20%.
- Very High negative margin companies, having net profit margin less than -50%.
With a net margin of 19.3%, Illumina was in the Medium positive net profit margin segment during 2016. There were a total of 1086 companies in the Medium positive net profit margin segment during 2016. Of the US top-3000 companies, 2244 (nearly three-fourth of the total) had positive net profit margin and 756 (nearly one-fourth of the total) had negative net profit margin during 2016.
Company Business Summary
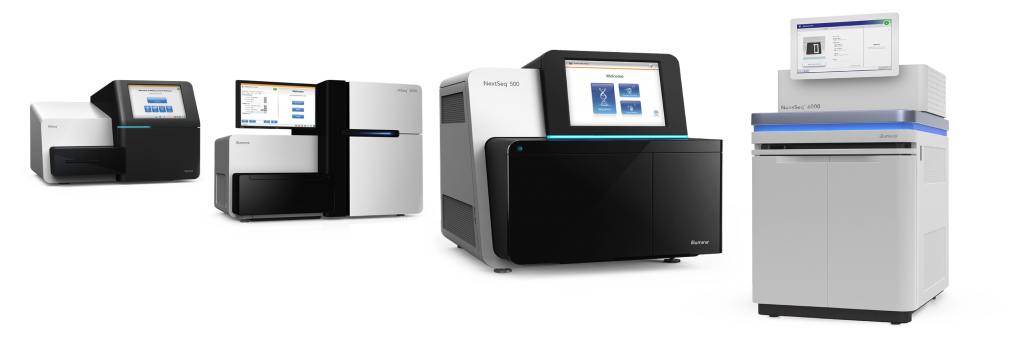
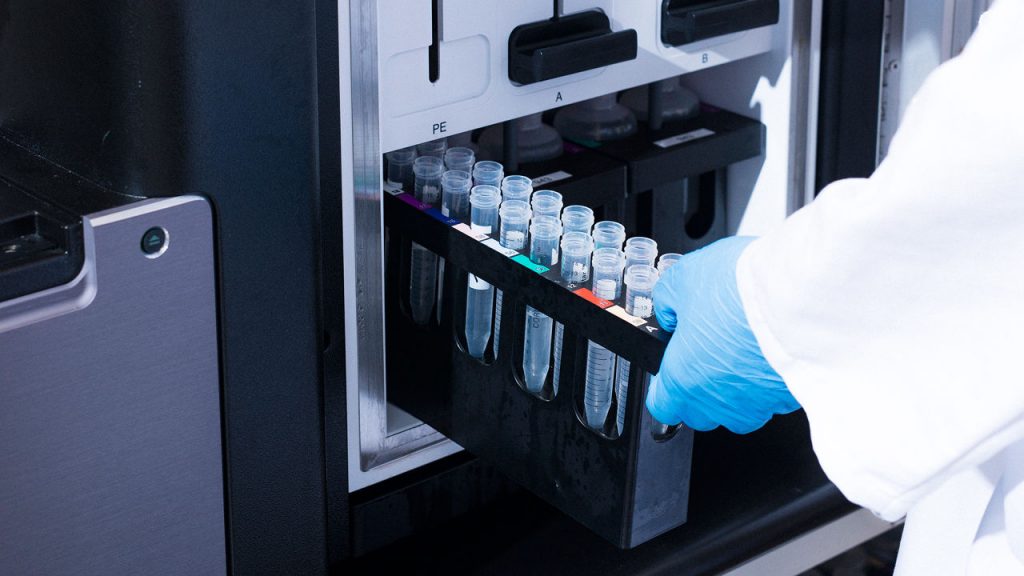
Illumina, Inc. provides sequencing and array-based solutions for genetic analysis. The company’s sequencing by synthesis technology provides researchers with various applications and the ability to sequence mammalian genomes. It also offers arrays for a range of deoxyribonucleic acid and RNA analysis applications, including single nucleotide polymorphism genotyping, copy number variations analysis, gene expression analysis, and methylation analysis, as well as allow for the detection of known genetic markers on a single array. In addition, the company provides various library preparation and sequencing kits to simplify workflows and accelerate analysis; and genome sequencing, genotyping, and non-invasive prenatal testing services. It serves genomic research centers, academic institutions, government laboratories, and hospitals, as well as pharmaceutical, biotechnology, agrigenomics, commercial molecular diagnostic laboratories, and consumer genomics companies. The company markets and distributes its products directly to customers in North America, Europe, Latin America, and the Asia-Pacific region, as well as through life-science distributors. It has collaboration agreements with IBM Watson Health to access genome data interpretation by integrating Watson for genomics into Illumina’s BaseSpace Sequence Hub and tumor sequencing process; and NRGene to develop new molecular breeding tools for cattle to support global food production. The company also has a co-development agreement with Munich Leukemia Laboratory GmbH and IBM Watson Health to build a cognitive technology prototype to help researchers improve leukemia treatment. Illumina, Inc. was founded in 1998 and is headquartered in San Diego, California.
DATA SOURCE
The chart and the data on this page are sourced from the R&P; Research Industry Intelligence Platform. The platform provides the key financial metrics for all the public companies in the United States. The platform empowers users to compare last five or 15 years financial data of a company with the other companies or the industry averages. This benchmarking exercise yields powerful insights that can drive better business decisions.
INDUSTRY PEERS AND COMPETITORS OF ILLUMINA

Agilent Technologies (A) Business Analysis – Analyze Historical Performance, Strategic Priorities,…
Agilent Technologies Inc with $4 billion revenues in the year 2016 was the number 3 Diagnostics & Scientific Instruments company. Read this report to know the top competitors of Agilent Technologies and identify growth and cost optimization opportunities of Agilent Technologies
Hologic (HOLX) Business Analysis – Analyze Historical Performance, Strategic Priorities, And…
Hologic Inc with $3 billion revenues in the year 2016 was the number 4 Diagnostics & Scientific Instruments company. Read this report to know the top competitors of Hologic and identify growth and cost optimization opportunities of Hologic
Mettler Toledo (MTD) Business Analysis – Analyze Historical Performance, Strategic Priorities,…
Mettler Toledo International Inc with $3 billion revenues in the year 2016 was the number 5 Diagnostics & Scientific Instruments company. Read this report to know the top competitors of Mettler Toledo and identify growth and cost optimization opportunities of Mettler Toledo
Waters (WAT) Business Analysis – Analyze Historical Performance, Strategic Priorities, And…
Waters Corp with $2 billion revenues in the year 2016 was the number 7 Diagnostics & Scientific Instruments company. Read this report to know the top competitors of Waters and identify growth and cost optimization opportunities of Waters
PerkinElmer (PKI) Business Analysis – Analyze Historical Performance, Strategic Priorities, And…
PerkinElmer Inc with $2 billion revenues in the year 2016 was the number 8 Diagnostics & Scientific Instruments company. Read this report to know the top competitors of PerkinElmer and identify growth and cost optimization opportunities of PerkinElmer
Bio-Rad (BIO) Business Analysis – Analyze Historical Performance, Strategic Priorities, And…
Bio-Rad Laboratories Inc with $2 billion revenues in the year 2016 was the number 9 Diagnostics & Scientific Instruments company. Read this report to know the top competitors of Bio-Rad and identify growth and cost optimization opportunities of Bio-Rad
REVENUES ANALYSIS

Illumina (ILMN) Revenues And Revenue Growth From 2012 To 2016
This report provides the last five years revenues and revenue growth of Illumina Inc (ILMN) from 2012 to 2016. Illumina generated a total of $2.4 billion revenues during 2016. Illumina reported a revenue growth of 8% year-over-year during 2016. The revenues and the revenue growth correspond to the fiscal year ending in December.
Illumina (ILMN) Revenues And Revenue Growth From 2002 To 2016
This report provides the last fifteen years revenues and revenue growth of Illumina Inc (ILMN) from 2002 to 2016. Illumina generated a total of $2.4 billion revenues during 2016. Illumina reported a revenue growth of 8% year-over-year during 2016. The revenues and the revenue growth correspond to the fiscal year ending in December.
Illumina (ILMN) Revenue Growth Comparison With Industry Growth From 2012 To…
This report provides a comparison of Illumina Inc (ILMN) revenue growth with Diagnostics & Scientific Instruments industry growth during the last five years from 2012 to 2016. Illumina reported a revenue growth of 8% year-over-year during 2016. The Diagnostics & Scientific Instruments industry growth was 6.8% year-over-year during 2016. Illumina growth was faster than the industry during 2016.
PROFIT ANALYSIS

Illumina (ILMN) Net Profit And Net Margin From 2012 To 2016
This report provides the last five years net profit and net margin of Illumina Inc (ILMN) from 2012 to 2016. Illumina reported a total net income of $462.6 million during 2016. Illumina generated a total of $2.4 billion revenues during 2016. Illumina net profit margin was 19.3% during 2016. The net profit and the net profit margin correspond to the fiscal year ending in December.
Illumina (ILMN) Net Profit And Net Margin From 2002 To 2016
This report provides the last fifteen years net profit and net margin of Illumina Inc (ILMN) from 2002 to 2016. Illumina reported a total net income of $462.6 million during 2016. Illumina generated a total of $2.4 billion revenues during 2016. Illumina net profit margin was 19.3% during 2016. The net profit and the net profit margin correspond to the fiscal year ending in December.
Illumina (ILMN) Net Profit Margin Comparison With Industry From 2012 To…
This report provides a comparison of Illumina Inc (ILMN) net profit margin with Diagnostics & Scientific Instruments industry net profit margin during the last five years from 2012 to 2016. Illumina reported a net profit margin of 19.3% during 2016. The Diagnostics & Scientific Instruments industry net profit margin was 10.7% during 2016. Illumina was more profitable than the industry during 2016.
COST EXPENSES ANALYSIS

Illumina (ILMN) Cost of Sales (COGS) Analysis From 2012 To 2016
This report provides the last five years cost of sales (COGS) analysis of Illumina Inc (ILMN) from 2012 to 2016. Illumina spent a total of $731.9 million on COGS during 2016. Illumina generated a total of $2.4 billion revenues during 2016. As a percentage of revenues, Illumina spent 30.5% of its total revenues on COGS during 2016. The cost of sales (COGS) numbers are for the fiscal year ending in December.
Illumina (ILMN) Research & Development (R&D) Spending Analysis From 2012 To…
This report provides the last five years research and development (R&D;) expenses of Illumina Inc (ILMN) from 2012 to 2016. Illumina spent a total of $504.4 million on research and development (R&D;) activities during 2016. Illumina generated a total of $2.4 billion revenues during 2016. As a percentage of revenues, Illumina spent 21% of its total revenues on R&D; activities during 2016. The R&D; spending numbers are for the fiscal year ending in December.
Illumina (ILMN) Sales, Marketing, General & Administrative (SG&A) Spending Analysis From…
This report provides the last five years sales, marketing, general & administrative (SG&A;) expenses of Illumina Inc (ILMN) from 2012 to 2016. Illumina spent a total of $583 million on sales, marketing, general, and administrative (SG&A;) activities during 2016. Illumina generated a total of $2.4 billion revenues during 2016. As a percentage of revenues, Illumina spent 24.3% of its total revenues on SG&A; activities during 2016. The SG&A; spending numbers are for the fiscal year ending in December.
WORKING CAPITAL ANALYSIS

Illumina (ILMN) Inventory Spending Analysis From 2012 To 2016
This report provides the last five years inventory spending analysis of Illumina Inc (ILMN) from 2012 to 2016. Illumina invested a total of $300.2 million on inventories during 2016. Illumina generated a total of $2.4 billion revenues during 2016. As a percentage of revenues, Illumina invested 12.5% of its total revenues on inventories during 2016. The inventory numbers are for the fiscal year ending in December.
Illumina (ILMN) Accounts Receivable (A/R) Analysis From 2012 To 2016
This report provides the last five years Accounts Receivable (A/R) analysis of Illumina Inc (ILMN) from 2012 to 2016. Illumina invested a total of $381.3 million on accounts receivable during 2016. Illumina generated a total of $2.4 billion revenues during 2016. As a percentage of revenues, Illumina invested 15.9% of its total revenues on accounts receivable during 2016. The accounts receivable numbers are for the fiscal year ending in December.
Illumina (ILMN) Accounts Payable (A/P) Analysis From 2012 To 2016
This report provides the last five years Accounts Payable (A/P) analysis of Illumina Inc (ILMN) from 2012 to 2016. Illumina invested a total of $137.9 million on accounts payable during 2016. Illumina generated a total of $2.4 billion revenues during 2016. As a percentage of revenues, Illumina invested 5.8% of its total revenues on accounts payable activities during 2016. The accounts payable numbers are for the fiscal year ending in December.
ASSET MANAGEMENT ANALYSIS

Illumina (ILMN) Property, Plant & Equipment (PP&E) Investment Analysis From 2012…
This report provides the last five years property, plant & equipment (PP&E;) investment analysis of Illumina Inc (ILMN) from 2012 to 2016. Illumina invested a total of $713.3 million on property, plant & equipment (PP&E;) activities during 2016. Illumina generated a total of $2.4 billion revenues during 2016. As a percentage of revenues, Illumina invested 29.7% of its total revenues on PP&E; activities during 2016. The PP&E; investment numbers are for the fiscal year ending in December.
Illumina (ILMN) Intangible Assets Analysis From 2012 To 2016
This report provides the last five years Intangible assets analysis of Illumina Inc (ILMN) from 2012 to 2016. Illumina invested a total of $1 billion on Intangible assets during 2016. Illumina generated a total of $2.4 billion revenues during 2016. As a percentage of revenues, Illumina invested 42.5% of its total revenues on intangible assets during 2016. The Intangible asset numbers are for the fiscal year ending in December.


