
Excel is a powerful and versatile tool that has become an indispensable asset in the world of finance.
In this article, we will explore the various ways in which Excel can benefit your financial career and how you can make the most out of this software to excel in your role.
Increasing Qualifications

Improving your qualifications is instrumental in advancing your career in the financial sector, and mastering Excel is an essential part of this process. This tool’s advanced functionalities, such as financial functions, data analysis, and visualization capabilities, can provide you with a competitive edge.
Therefore, investing time in learning Excel and obtaining certification can significantly enhance your career prospects in the financial industry.
Data Analysis and Management
Excel is renowned for its robust data analysis capabilities. Financial professionals deal with vast amounts of data, ranging from historical financial statements to market trends.
Excel’s features like pivot tables, data sorting, and filtering make it easy to manage and analyze large datasets, allowing professionals to extract meaningful insights and trends. This is one of the main reasons many people seek online Excel training courses. Furthermore, Excel also offers a wide range of statistical functions that can help professionals make data-driven decisions and predictions.
Financial Modeling

Excel provides a platform for creating complex financial models that simulate different scenarios. Functions like NPV (Net Present Value), IRR (Internal Rate of Return), and the ability to create custom formulas make Excel an essential tool for financial modeling.
Moreover, Excel’s flexible design allows for easy adjustments and updates to financial models, making it a time-efficient option.
Visualization
In finance, being able to present data in a clear and visually appealing way is crucial. Excel offers various features that allow professionals to create dynamic charts and graphs that can effectively communicate financial information. This is especially useful when presenting complex analyses or reports to clients or stakeholders. Excel’s visualization capabilities make it easy to identify trends, patterns, and anomalies in data, making it an invaluable tool for financial professionals.
Automation and Efficiency
Excel offers a range of automation features, including macros and formulas, that can significantly reduce manual workload. For instance, using Excel’s VLOOKUP function can save hours of work compared to manually searching for data in a large dataset. Macros allow professionals to automate repetitive tasks, such as formatting and calculations, saving valuable time and effort.
By automating repetitive tasks, financial professionals can save time and minimize the risk of errors. This is especially important when dealing with financial calculations, where accuracy is paramount.
Graphs and Charts
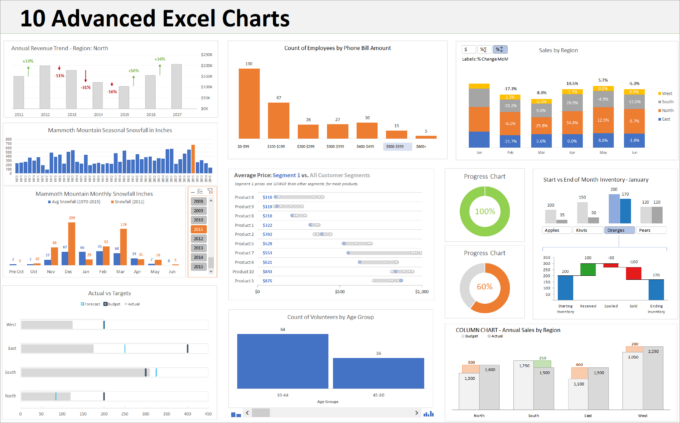
Visual representation of data is crucial in finance, and Excel excels in creating various charts and graphs.
Whether you need to present financial trends, compare performance, or illustrate market data, Excel’s charting capabilities make it easy to communicate complex information in a clear and visually appealing manner. This not only saves time but also enhances communication and understanding among colleagues and stakeholders.
Scenario Analysis
Financial decision-making often involves considering different scenarios and their potential impact on outcomes. Excel’s tools, such as data tables and goal seek, make it easy to conduct scenario analysis and compare different options. This is particularly useful in investment decision-making or risk management, where multiple variables need to be considered. Excel’s scenario analysis capabilities provide financial professionals with a powerful tool to evaluate different scenarios and make informed decisions.
Budgeting and Planning

Excel is widely used for budgeting and planning purposes. Financial professionals can create detailed budgets, track expenditures, and compare actual performance against budgeted figures.
The flexibility of Excel allows for the easy adjustment of budgets as circumstances change, providing real-time insights into financial performance. This is an essential tool for financial planning and ensuring the organization’s financial stability.
Financial Reporting
Excel is a preferred tool for creating financial reports and statements.
Professionals can customize reports according to specific requirements, add formulas for automatic calculations, and update data dynamically.
This flexibility ensures that financial reports are not only accurate but also tailored to the needs of different stakeholders. Moreover, Excel’s visualization features make reports more visually appealing and easier to understand.
Collaboration
Excel facilitates collaboration among team members by allowing multiple users to work on a spreadsheet simultaneously.
This is particularly useful in financial environments where teamwork and communication are essential.
Excel workbooks can be shared, and changes are tracked, making it easy to collaborate on financial analyses and reports. This comes in handy when working on complex financial models or analyzing large datasets with your team members.
Risk Management
Excel is a valuable tool for assessing and managing financial risks. Financial professionals can utilize Excel to create risk models and simulations, helping them evaluate the potential impact of various risk scenarios.
By incorporating statistical functions and analysis tools, Excel enables professionals to quantify and analyze risk factors, allowing for informed decision-making.
Additionally, Excel’s ability to handle complex calculations and perform stress testing makes it an essential tool in developing risk mitigation strategies, ensuring that financial decisions are well-informed and considerate of potential challenges.
Excel is an indispensable tool for professionals in financial careers. Its data analysis capabilities, financial modeling features, automation tools, and versatility make it an essential asset for anyone involved in financial analysis, planning, and decision-making.


