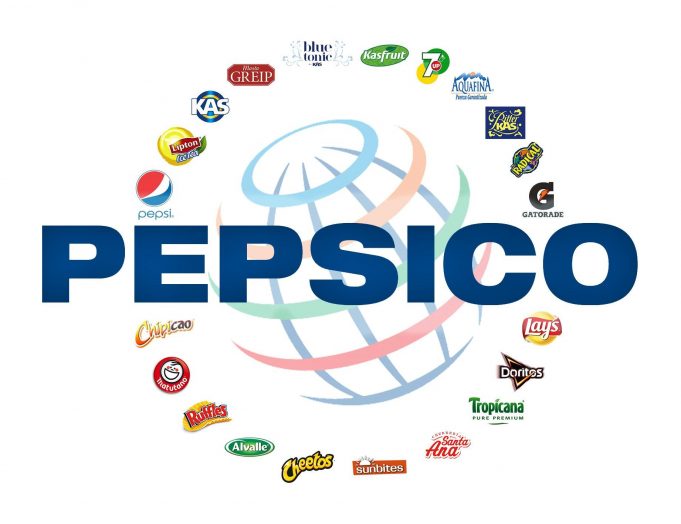
PepsiCo, Inc. operates as a food and beverage company worldwide. Its Frito-Lay North America segment offers Lay’s and Ruffles potato chips; Doritos, Tostitos, and Santitas tortilla chips; and Cheetos cheese-flavored snacks, branded dips, and Fritos corn chips. The company’s Quaker Foods North America segment provides Quaker oatmeal, grits, rice cakes, granola, and oat squares; and Aunt Jemima mixes and syrups, Quaker Chewy granola bars, Cap’n Crunch cereal, Life cereal, and Rice-A-Roni side dishes.
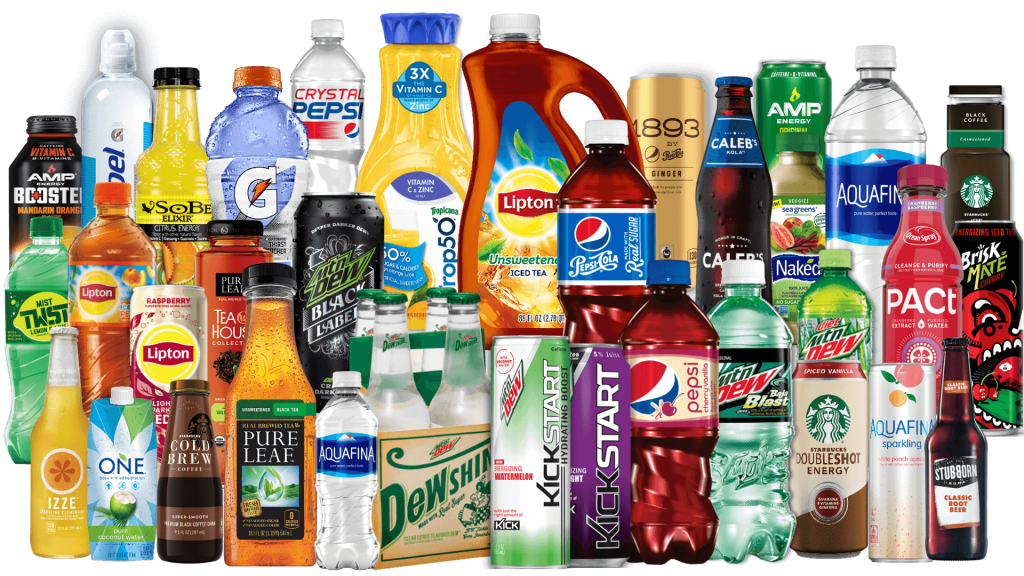
Its North America Beverages segment offers beverage concentrates, fountain syrups, and finished goods under the Pepsi, Gatorade, Mountain Dew, Diet Pepsi, Aquafina, Diet Mountain Dew, Tropicana Pure Premium, Mist Twst, and Mug brands; and ready-to-drink tea and coffee, and juices. The company’s Latin America segment provides snack foods under the Doritos, Cheetos, Marias Gamesa, Ruffles, Emperador, Saladitas, Sabritas, Lay’s, Rosquinhas Mabel, and Tostitos brands; cereals and snacks under the Quaker brand; and beverage concentrates, fountain syrups, and finished goods under the Pepsi, 7UP, Gatorade, Toddy, Mirinda, Manzanita Sol, H2oh!, and Diet Pepsi brands.
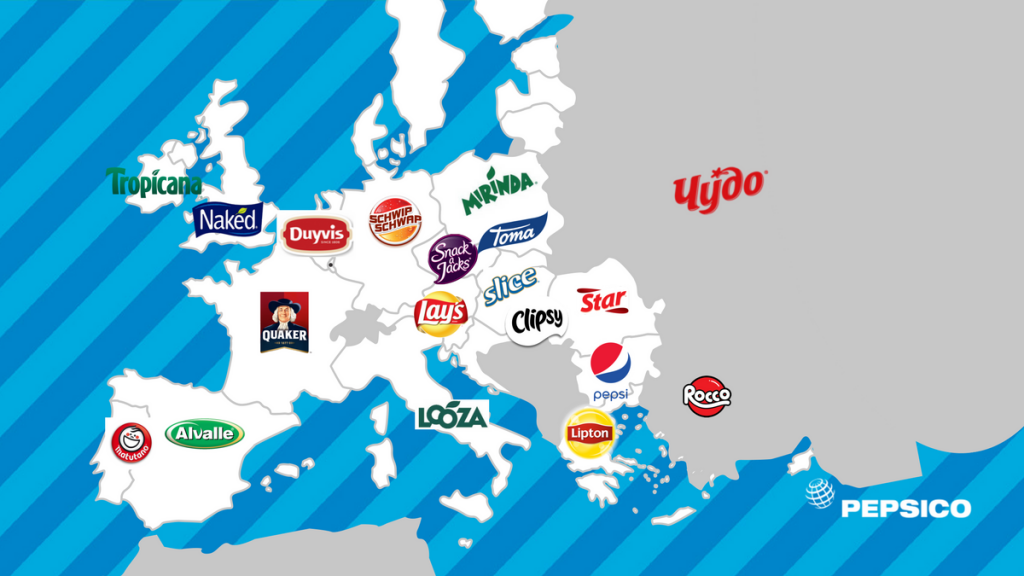
Its Europe Sub-Saharan Africa segment offers snack foods under the Lay’s, Walkers, Doritos, Cheetos, and Ruffles brands; cereals and snacks under the Quaker brand; beverage concentrates, fountain syrups, and finished goods under the Pepsi, 7UP, Pepsi Max, Mirinda, Diet Pepsi, and Tropicana brands; ready-to-drink tea products; and dairy products under the Chudo, Agusha, and Domik v Derevne brands.
The company’s Asia, Middle East and North Africa segment provides snack foods under the Lay’s, Kurkure, Chipsy, Doritos, Cheetos, and Crunchy brands; cereals and snacks under the Quaker brand; beverage concentrates, fountain syrups, and finished goods under the Pepsi, Mirinda, 7UP, Mountain Dew, Aquafina, and Tropicana brands; and tea products. The company was founded in 1898 and is headquartered in Purchase, New York.
BUSINESS ANALYSIS OF PEPSICO
The Consumer Goods Sector is witnessing a major shakeup, new age business models in the industry are transforming both customers and businesses.
Faced with this uncertainty, companies are investing resources to transform their business. An in-depth business analysis is a valuable resource to identify and articulate the need for a business model change. At R&P Research we believe, the starting point for a business analysis is Benchmarking. Business benchmarking can be done at various levels: 1) Industry Benchmarking 2) Peer Benchmarking 3) Disruptors Benchmarking.
In this report, we share the snapshot of how PepsiCo compares against the industry on the major performance indicators. This analysis, along with peer group/disruptors benchmarking and revenue model understanding can help identify growth and cost optimization opportunities to maximize the value delivered by PepsiCo to its stakeholders. R&P Research Industry Intelligence Platform provides historical data for last 15 years with an easy to use benchmarking interface for an in-depth comparative business analysis.
Here is the performance snapshot of PepsiCo with an interactive chart.
- Revenue Growth: PepsiCo reported a revenue growth of -0.4% year-on-year during 2016. Beverages Industry grew at 1.8% in the same period
- COGS share of Revenues: As a percentage of revenue, PepsiCo spent 44.9% of its total revenues on COGS. Beverages industry average (COGS share of revenue) in the same period was 48.6%
- R&D; share of Revenues: PepsiCo R&D; share of Revenues details are not available because either company does not share the data or we do not have it
- SG&A; share of Revenues: As a percentage of revenue, PepsiCo spent 39.4% of its total revenues on Sales, Marketing, and General Administration (SG&A;). Beverages industry average SG&A; spending in the same period was 32.0%
- Inventory share of Revenues: As a percentage of revenue, PepsiCo spent 4.3% of its total revenues on Inventories. Beverages industry average Inventory spending in the same period was 7.1%
- Accounts Payable share of Revenues: As a percentage of revenue, PepsiCo invested 22.7% of its total revenues on Accounts Payable (A/P) Beverages industry average Accounts Payable investment in the same period was 18.4%
- Accounts Receivable share of Revenues: As a percentage of revenue, PepsiCo invested 10.7% of its total revenues on Accounts Receivable (A/R). Beverages industry average Accounts Receivable investment in the same period was 9.7%
- PP&E; share of Revenues: As a percentage of revenue, PepsiCo invested 26.4% of its total revenues on Property, Plants, and Equipments (PP&E;). Beverages industry average PPE investment in the same period was 27.6%
- Intangibles share of Revenues: As a percentage of revenue, PepsiCo invested 44.4% of its total revenues on Intangibles. Beverages industry average Intangibles investment in the same period was 60.4%
- Net Margins: PepsiCo Net Margins in the year 2016 were 10.1%. Beverages industry average Net Margins in the same period were 13.5%
SECTOR AND INDUSTRY ASSOCIATION OF PEPSICO
For the purpose of performance benchmarking of a company with a sector or industry average, R&P; Research associates every company with one sector and one industry. An industry consists of companies with related/similar business models. A sector comprises of a group of related/similar industries.
PepsiCo is associated with Consumer Goods Sector and Beverages Industry.
Consumer Goods sector is comprised of the following industries: Beverages; Personal Goods; Food Products; Diversified Food; Household Goods & Home Construction; Food Distribution; Toys and Games. The definitions for each of the industries is as follows:
- Beverages industry consists of: Brewing Companies – manufacturers of cider or malt products; Distillers and Vintners Companies; and Soft Drinks Companies – manufacturers, bottlers and distributors of nonalcoholic beverages, such as soda, fruit juices, tea, coffee and bottled water.
- Personal Goods industry includes: Clothing & Accessories Companies – manufacturers and distributors of all types of clothing, jewellery, watches or textiles, sportswear, sunglasses, eyeglass frames, leather clothing and goods, and processors of hides and skins; Footwear Companies – manufacturers and distributors of shoes, boots, sandals, sneakers and other types of footwear; and Consumer Packaged Goods Companies – makers and distributors of cosmetics, toiletries and personal-care and hygiene products, including deodorants, soaps, toothpaste, perfumes, diapers, shampoos, razors and feminine hygiene products.
- Food Products industry includes: Farming & Fishing companies – companies that grow crops or raise livestock; Food Products Companies – food producers, including meatpacking, snacks, fruits, vegetables, dairy products and frozen seafood. It also includes producers of pet food and manufacturers of dietary supplements, vitamins and related items.
- Diversified Food industry includes companies that offer a diverse portfolio of food products across agricultural, animal and dairy product categories.
- Household Goods & Home Construction industry includes companies that offer: Durable Household Products – Manufacturers and distributors of domestic appliances, lighting, hand tools and power tools, hardware, cutlery, tableware, garden equipment, luggage, towels and linens; Nondurable Household Products – Producers and distributors of pens, paper goods, batteries, light bulbs, tissues, toilet paper and cleaning products such as soaps and polishes; Furnishings – Manufacturers and distributors of furniture, including chairs, tables, desks, carpeting, wallpaper and office furniture; Home Construction – constructors of residential homes, including manufacturers of mobile and prefabricated homes intended for use in one place.
- Food Distribution industry includes companies that distribute food, beverage and consumer goods to restaurants, healthcare, educational facilities, lodging establishments; equipment and supplies for the foodservice and hospitality industries.
- Toys and Games industry consists of manufacturers and distributors of toys and video/computer games, including such toys and games as playing cards, board games, stuffed animals and dolls.
INDUSTRY RANKING OF PEPSICO
With $62.8 billion revenues, PepsiCo ranked number 1 of all the companies in the US Beverages industry. There were a total of 18 public companies in the US Beverages industry that had revenues greater than $50 million during 2016.
The top-10 companies in the US Beverages industry by revenues during 2016 were:
- PepsiCo ($62.8 billion)
- Coca-Cola ($41.9 billion)
- Starbucks ($21.3 billion)
- Constellation Brands ($6.5 billion)
- Dr Pepper Snapple Group ($6.4 billion)
- Molson Coors Brewing ($4.9 billion)
- Brown-Forman Corp ($4 billion)
- Cott ($3.2 billion)
- Coca Cola Bottling ($3.2 billion)
- Monster Beverage ($3 billion)
BUSINESS MODEL ANALYSIS (BMA) FRAMEWORK
We use the following framework to assess the business model of a company. Business Model Analysis framework can be used by organizations to articulate growth strategies and identify cost optimization opportunities. Technology and consulting companies can use this framework to identify the value drivers and pain points of their targeted customers. Entrepreneurs can use this framework to understand the language of business and identify promising business opportunities. This framework can be used by any professional aspiring to take up a leadership role to better understand the businesses challenges, articulate growth strategy, and monitor the business improvement requirements for the organization.
NEXT STEPS
- Conduct a holistic benchmarking; to identify and target additional sources of value
- Get in touch with us to learn more about Business Model Analysis Framework
- Get free data, charts, and analysis of PepsiCoand its peers on select key performance indicators by clicking the reports provided below
