source: medtech.pharmaintelligence.informa.com

Stryker Corporation, together with its subsidiaries, operates as a medical technology company. It operates through three segments: Orthopaedics; MedSurg; and Neurotechnology and Spine. The Orthopaedics segment offers implants for use in hip and knee joint replacements, and trauma and extremities surgeries. The MedSurg segment provides surgical equipment and surgical navigation systems, endoscopic and communications systems, patient handling, emergency medical equipment and intensive care disposable products, and reprocessed and remanufactured medical devices, as well as other medical devices for use in various medical specialties. The Neurotechnology and Spine segment offers neurosurgical and neurovascular devices that include products used for minimally invasive endovascular techniques; products for brain and open skull based surgical procedures; orthobiologic and biosurgery products, including synthetic bone grafts and vertebral augmentation products; and minimally invasive products for the treatment of acute ischemic and hemorrhagic stroke. This segment also provides spinal implant products, which consists of cervical, thoracolumbar, and interbody systems for use in spinal injury, deformity, and degenerative therapies. The company markets and sells its products to doctors, hospitals, and other healthcare facilities through company-owned sales subsidiaries and branches, as well as third-party dealers and distributors in approximately 100 countries. Stryker Corporation was founded in 1941 and is headquartered in Kalamazoo, Michigan.

source: fr.m.wikipedia.org

BUSINESS ANALYSIS OF STRYKER

The Life Sciences Sector is witnessing a major shakeup, new age business models in the industry are transforming both customers and businesses. Faced with this uncertainity, companies are investing resources to transform their business. An in-depth business analysis is a valuable resource to identify and articulate the need for a business model change. At R&P Research we believe, the starting point for a business analysis is Benchmarking. Business benchmarking can be done at various levels: 1) Industry Benchmarking 2) Peer Benchmarking 3) Disruptors Benchmarking. In this report, we share the snapshot of how Stryker compares against the industry on the major performance indicators. This analysis, along with peer group/disruptors benchmarking and revenue model understanding can help identify growth and cost optimization opportunities to maximize the value delivered by Stryker to its stakeholders. R&P Research Industry Intelligence Platform provides historical data for last 15 years with an easy to use benchmarking interface for an in-depth comparative business analysis.

  1. Revenue Growth: Stryker reported a revenue growth of 13.9% year-on-year during 2016. Medical Devices Industry grew at 20.5% in the same period
  2. COGS share of Revenues: As a percentage of revenue, Stryker spent 33.8% of its total revenues on COGS. Medical Devices industry average (COGS share of revenue) in the same period was 41.0%
  3. R&D; share of Revenues: As a percentage of revenue, Stryker spent 6.3% of its total revenues on R&D.; Medical Devices industry average R&D; spending in the same period was 7.2%
  4. SG&A; share of Revenues: As a percentage of revenue, Stryker spent 36.5% of its total revenues on Sales, Marketing, and General Administration (SG&A;). Medical Devices industry average SG&A; spending in the same period was 33.2%
  5. Inventory share of Revenues: As a percentage of revenue, Stryker spent 17.9% of its total revenues on Inventories. Medical Devices industry average Inventory spending in the same period was 14.8%
  6. Accounts Payable share of Revenues: As a percentage of revenue, Stryker invested 5.3% of its total revenues on Accounts Payable (A/P) Medical Devices industry average Accounts Payable investment in the same period was 9.1%
  7. Accounts Receivable share of Revenues: As a percentage of revenue, Stryker invested 17.4% of its total revenues on Accounts Receivable (A/R). Medical Devices industry average Accounts Receivable investment in the same period was 17.3%
  8. PP&E; share of Revenues: As a percentage of revenue, Stryker invested 13.9% of its total revenues on Property, Plants, and Equipments (PP&E;). Medical Devices industry average PPE investment in the same period was 22.2%
  9. Intangibles share of Revenues: As a percentage of revenue, Stryker invested 87.1% of its total revenues on Intangibles. Medical Devices industry average Intangibles investment in the same period was 124.7%
  10. Net Margins: Stryker Net Margins in the year 2016 were 14.5%. Medical Devices industry average Net Margins in the same period were 11.7%
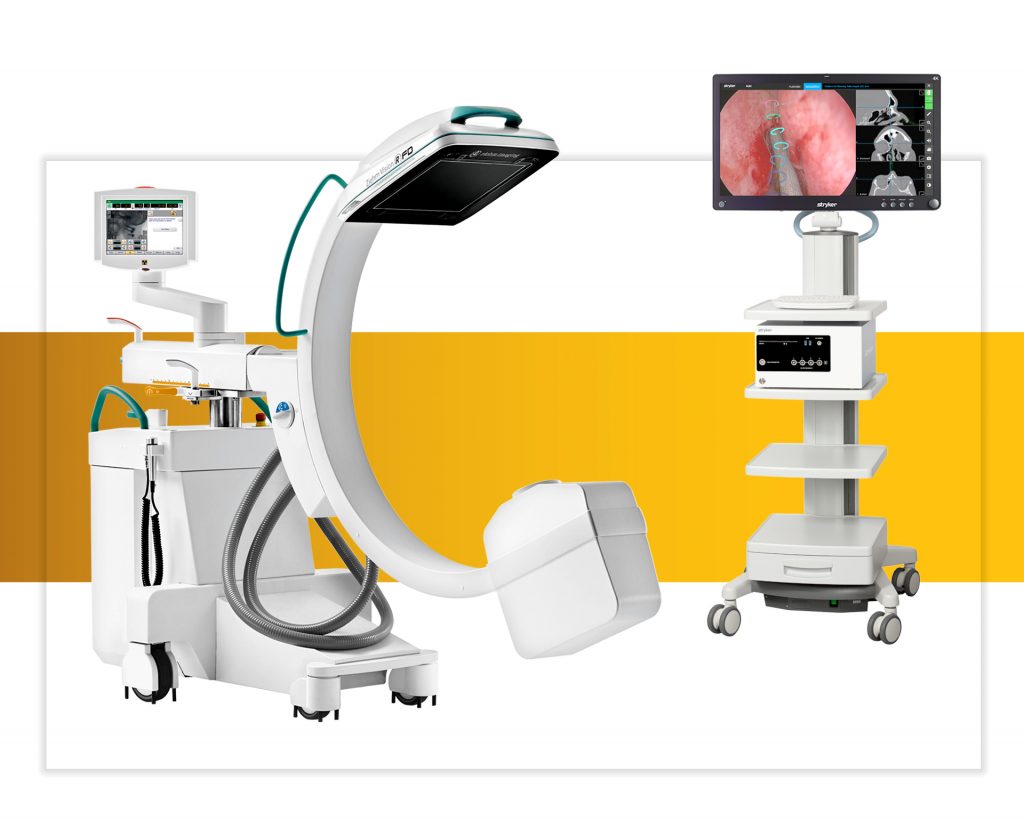
source: neurosurgical.stryker.com

SECTOR AND INDUSTRY ASSOCIATION OF STRYKER

For the purpose of performance benchmarking of a company with a sector or industry average, R&P; Research associates every company with one sector and one industry. An industry consists of companies with related/similar business models. A sector comprises of a group of related/similar industries. For high-level analysis purposes, related/similar sectors are grouped into sector groups.

Stryker is associated with Healthcare Sector Group, Life Sciences Sector, and Medical Devices Industry.

Life Sciences sector is comprised of the following industries: Pharmaceuticals; Medical Devices; Biotechnology; Diagnostics & Scientific Instruments. The definitions for each of the industries is as follows:

  • Pharmaceuticals industry includes companies that discover, develop, manufacture, and market medicines licensed for use as medications. In general these companies offer pharmaceutical products that can be described as prescription or over-the-counter medicines. Many Pharmaceutical companies also offer a diverse portfolio of animal health products, services and solutions. Many diversified pharmaceutical companies operate in more than two operating segments like consumer health products, medical devices and pharmaceutical.
  • Medical Devices industry includes manufacturers and distributors of medical equipments and medical supplies. Medical equipments include large scale capital equipmets such as X-Ray machines and MRI scanners and other nondisposable medical devices like stents and pacemakers. Medical supplies include makers of contact lenses, eyeglass lenses, bandages and other disposable products.
  • Biotechnology industry includes Biotechnology product companies, subscription companies, and service companies. Biotechnology product companies offer pharmaceutical medication products that are manufactured in, extracted from, or semi synthesized from biological sources. Subscription-based companies develop genome databases, which can be used to develop medicinal products. Service companies offer solutions based on a common technology or generic tool of other large pharmaceutical or biopharmaceutical companies.
  • Diagnostics & Scientific Instruments industry includes companies that provide testing products, diagnostic reagents, instruments and diagnostic services to aid in the detection and treatment of a wide range of diseases. It also includes molecular diagnostic and genetic testing companies that develop, manufacture, market and provide diagnostic tests, diagnostic systems and related products and services. Also included are companies that manufacture and market analytical instruments, equipment, reagents and consumables, software and services for research, manufacturing, analysis, discovery and diagnostics.
source: canvas.pantone.com

INDUSTRY RANKING OF STRYKER

With $11.3 billion revenues, Stryker ranked number 3 of all the companies in the US Medical Devices industry. There were a total of 81 public companies in the US Medical Devices industry that had revenues greater than $50 million during 2016.

The top-10 companies in the US Medical Devices industry by revenues during 2016 were:

  1. Medtronic ($28.8 billion)
  2. Becton Dickinson ($12.5 billion)
  3. Stryker ($11.3 billion)
  4. Baxter International ($10.2 billion)
  5. Boston Scientific ($8.4 billion)
  6. Zimmer Biomet ($7.7 billion)
  7. Dentsply Sirona ($3.7 billion)
  8. C. R. Brad ($3.7 billion)
  9. Varian Medical Systems ($3.2 billion)
  10. Edwards Lifesciences ($3 billion)

BUSINESS MODEL ANALYSIS (BMA) FRAMEWORK

We use the following framework to assess the business model of a company. Business Model Analysis framework can be used by organizations to articulate growth strategies and identify cost optimization opportunities. Technology and consulting companies can use this framework to identify the value drivers and pain points of their targeted customers. Entrepreneurs can use this framework to understand the language of business and identify promising business opportunities. This framework can be used by any professional aspiring to take up a leadership role to better understand the businesses challenges, articulate growth strategy, and monitor the business improvement requirements for the organization.

INDUSTRY PEERS AND COMPETITORS OF STRYKER

Medtronic (MDT) Business Analysis – Analyze Historical Performance, Strategic Priorities, And…

Medtronic Plc with $29 billion revenues in the year 2016 was the number 1 Medical Devices company. Read this report to know the top competitors of Medtronic and identify growth and cost optimization opportunities of Medtronic

Becton Dickinson (BDX) Business Analysis – Analyze Historical Performance, Strategic Priorities,…

Becton Dickinson & Co with $12 billion revenues in the year 2016 was the number 2 Medical Devices company. Read this report to know the top competitors of Becton Dickinson and identify growth and cost optimization opportunities of Becton Dickinson

Baxter International (BAX) Business Analysis – Analyze Historical Performance, Strategic Priorities,…

Baxter International Inc with $10 billion revenues in the year 2016 was the number 4 Medical Devices company. Read this report to know the top competitors of Baxter International and identify growth and cost optimization opportunities of Baxter International

Boston Scientific (BSX) Business Analysis – Analyze Historical Performance, Strategic Priorities,…

Boston Scientific Corp with $8 billion revenues in the year 2016 was the number 5 Medical Devices company. Read this report to know the top competitors of Boston Scientific and identify growth and cost optimization opportunities of Boston Scientific

Zimmer Biomet (ZBH) Business Analysis – Analyze Historical Performance, Strategic Priorities,…

Zimmer Biomet Holdings, Inc. with $8 billion revenues in the year 2016 was the number 6 Medical Devices company. Read this report to know the top competitors of Zimmer Biomet and identify growth and cost optimization opportunities of Zimmer Biomet

Dentsply Sirona (XRAY) Business Analysis – Analyze Historical Performance, Strategic Priorities,…

Dentsply Sirona Inc. with $4 billion revenues in the year 2016 was the number 7 Medical Devices company. Read this report to know the top competitors of Dentsply Sirona and identify growth and cost optimization opportunities of Dentsply Sirona

REVENUES ANALYSIS

Stryker (SYK) Revenues And Revenue Growth From 2012 To 2016

This report provides the last five years revenues and revenue growth of Stryker Corp (SYK) from 2012 to 2016. Stryker generated a total of $11.3 billion revenues during 2016. Stryker reported a revenue growth of 13.9% year-over-year during 2016. The revenues and the revenue growth correspond to the fiscal year ending in December.

Stryker (SYK) Revenues And Revenue Growth From 2002 To 2016

This report provides the last fifteen years revenues and revenue growth of Stryker Corp (SYK) from 2002 to 2016. Stryker generated a total of $11.3 billion revenues during 2016. Stryker reported a revenue growth of 13.9% year-over-year during 2016. The revenues and the revenue growth correspond to the fiscal year ending in December.

Stryker (SYK) Revenue Growth Comparison With Industry Growth From 2012 To…

This report provides a comparison of Stryker Corp (SYK) revenue growth with Medical Devices industry growth during the last five years from 2012 to 2016. Stryker reported a revenue growth of 13.9% year-over-year during 2016. The Medical Devices industry growth was 20.5% year-over-year during 2016. Stryker growth was slower than the industry during 2016.

PROFIT ANALYSIS

Stryker (SYK) Net Profit And Net Margin From 2012 To 2016

This report provides the last five years net profit and net margin of Stryker Corp (SYK) from 2012 to 2016. Stryker reported a total net income of $1.6 billion during 2016. Stryker generated a total of $11.3 billion revenues during 2016. Stryker net profit margin was 14.5% during 2016. The net profit and the net profit margin correspond to the fiscal year ending in December.

Stryker (SYK) Net Profit And Net Margin From 2002 To 2016

This report provides the last fifteen years net profit and net margin of Stryker Corp (SYK) from 2002 to 2016. Stryker reported a total net income of $1.6 billion during 2016. Stryker generated a total of $11.3 billion revenues during 2016. Stryker net profit margin was 14.5% during 2016. The net profit and the net profit margin correspond to the fiscal year ending in December.

Stryker (SYK) Net Profit Margin Comparison With Industry From 2012 To…

This report provides a comparison of Stryker Corp (SYK) net profit margin with Medical Devices industry net profit margin during the last five years from 2012 to 2016. Stryker reported a net profit margin of 14.5% during 2016. The Medical Devices industry net profit margin was 11.7% during 2016. Stryker was more profitable than the industry during 2016.

COST & EXPENSES ANALYSIS

Stryker (SYK) Cost of Sales (COGS) Analysis From 2012 To 2016

This report provides the last five years cost of sales (COGS) analysis of Stryker Corp (SYK) from 2012 to 2016. Stryker spent a total of $3.8 billion on COGS during 2016. Stryker generated a total of $11.3 billion revenues during 2016. As a percentage of revenues, Stryker spent 33.8% of its total revenues on COGS during 2016. The cost of sales (COGS) numbers are for the fiscal year ending in December.

Stryker (SYK) Research & Development (R&D) Spending Analysis From 2012 To…

This report provides the last five years research and development (R&D;) expenses of Stryker Corp (SYK) from 2012 to 2016. Stryker spent a total of $715 million on research and development (R&D;) activities during 2016. Stryker generated a total of $11.3 billion revenues during 2016. As a percentage of revenues, Stryker spent 6.3% of its total revenues on R&D; activities during 2016. The R&D; spending numbers are for the fiscal year ending in December.

Stryker (SYK) Sales, Marketing, General & Administrative (SG&A) Spending Analysis From…

This report provides the last five years sales, marketing, general & administrative (SG&A;) expenses of Stryker Corp (SYK) from 2012 to 2016. Stryker spent a total of $4.1 billion on sales, marketing, general, and administrative (SG&A;) activities during 2016. Stryker generated a total of $11.3 billion revenues during 2016. As a percentage of revenues, Stryker spent 36.5% of its total revenues on SG&A; activities during 2016. The SG&A; spending numbers are for the fiscal year ending in December.

WORKING CAPITAL ANALYSIS

Stryker (SYK) Inventory Spending Analysis From 2012 To 2016

This report provides the last five years inventory spending analysis of Stryker Corp (SYK) from 2012 to 2016. Stryker invested a total of $2 billion on inventories during 2016. Stryker generated a total of $11.3 billion revenues during 2016. As a percentage of revenues, Stryker invested 17.9% of its total revenues on inventories during 2016. The inventory numbers are for the fiscal year ending in December.

Stryker (SYK) Accounts Receivable (A/R) Analysis From 2012 To 2016

This report provides the last five years Accounts Receivable (A/R) analysis of Stryker Corp (SYK) from 2012 to 2016. Stryker invested a total of $2 billion on accounts receivable during 2016. Stryker generated a total of $11.3 billion revenues during 2016. As a percentage of revenues, Stryker invested 17.4% of its total revenues on accounts receivable during 2016. The accounts receivable numbers are for the fiscal year ending in December.

Stryker (SYK) Accounts Payable (A/P) Analysis From 2012 To 2016

This report provides the last five years Accounts Payable (A/P) analysis of Stryker Corp (SYK) from 2012 to 2016. Stryker invested a total of $596 million on accounts payable during 2016. Stryker generated a total of $11.3 billion revenues during 2016. As a percentage of revenues, Stryker invested 5.3% of its total revenues on accounts payable activities during 2016. The accounts payable numbers are for the fiscal year ending in December.

ASSET MANAGEMENT ANALYSIS

Stryker (SYK) Property, Plant & Equipment (PP&E) Investment Analysis From 2012…

This report provides the last five years property, plant & equipment (PP&E;) investment analysis of Stryker Corp (SYK) from 2012 to 2016. Stryker invested a total of $1.6 billion on property, plant & equipment (PP&E;) activities during 2016. Stryker generated a total of $11.3 billion revenues during 2016. As a percentage of revenues, Stryker invested 13.9% of its total revenues on PP&E; activities during 2016. The PP&E; investment numbers are for the fiscal year ending in December.

Stryker (SYK) Intangible Assets Analysis From 2012 To 2016

This report provides the last five years Intangible assets analysis of Stryker Corp (SYK) from 2012 to 2016. Stryker invested a total of $9.9 billion on Intangible assets during 2016. Stryker generated a total of $11.3 billion revenues during 2016. As a percentage of revenues, Stryker invested 87.1% of its total revenues on intangible assets during 2016. The Intangible asset numbers are for the fiscal year ending in December.