Swing trading has long been a popular approach for active traders looking to capitalise on market fluctuations over short to medium-term periods. Unlike day traders, who buy and sell within the same trading day, swing traders hold positions for several days or even weeks, aiming to profit from price “swings” or trends. This trading style provides opportunities to capture significant price moves without the pressure of monitoring the market constantly.
In this article, we’ll explore the essentials of swing trading, popular strategies, key tools, and how to create a personalised trading plan that potentially maximises success.
Understanding Swing Trading

Swing trading revolves around taking advantage of price movements within a trend. Traders identify an asset’s price direction and aim to enter and exit positions based on anticipated swings, often riding trends for a few days to a few weeks.
Unlike long-term investing or day trading, which demands extensive capital or constant market watching, swing trading is accessible and allows for more relaxed yet informed decision-making.
The key to swing trading lies in understanding market conditions. Ideal markets for swing trading are often trending or volatile, where price movements are distinct enough to allow for predictable shifts.
These conditions allow traders to catch significant price movements without staying glued to their screens. The time horizon for swing trades typically spans from a couple of days to several weeks, depending on the volatility of the asset and the trader’s strategy.
Traders commonly focus on stocks, but swing trading is equally applicable in forex, commodities, and other financial markets.
The essential principle in swing trading is to capture a portion of a price move by buying or selling at the right time, based on technical analysis, rather than trying to predict long-term trends. Click to learn more.
Key Concepts and Tools for Swing Trading

To succeed in swing trading, traders rely heavily on technical analysis. Technical analysis is the study of historical price data and trading volume to forecast future price movements.
Through the use of charts, patterns, and indicators, traders can identify market trends and predict the likelihood of price movements. One of the cornerstones of swing trading is identifying support and resistance levels—price points at which an asset tends to reverse direction.
Support levels are where prices tend to find a “floor,” while resistance levels act as ceilings. Understanding where these levels lie helps traders predict when a trend is likely to reverse, providing opportunities to enter or exit positions.
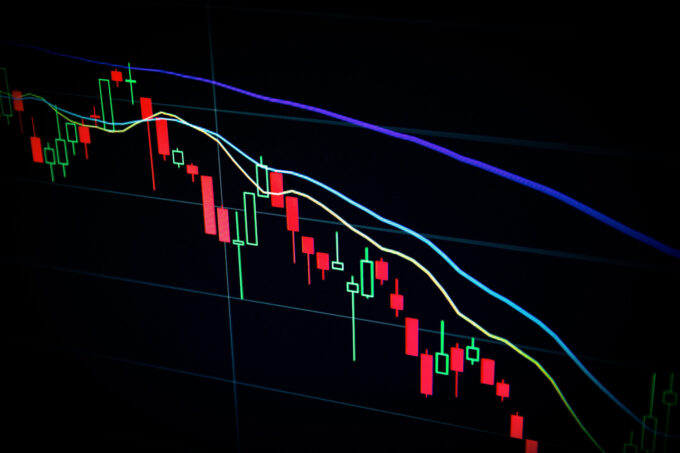
Coupled with this, swing traders frequently use technical indicators, such as moving averages, the Relative Strength Index (RSI), and Bollinger Bands, to spot potential entry and exit points.
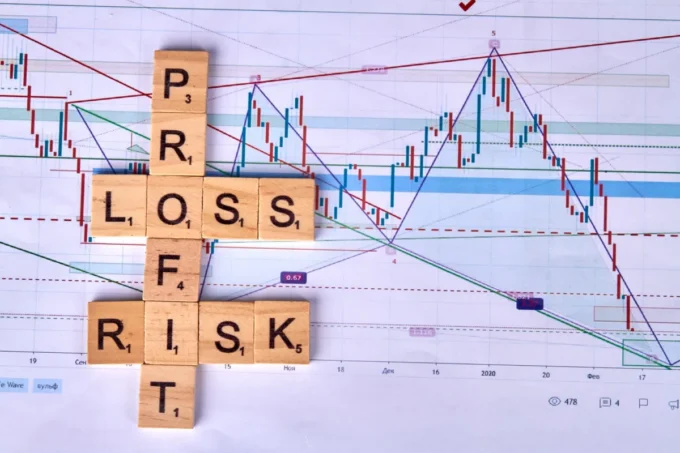
Risk management is another critical component of swing trading. Stop-loss orders are essential for controlling losses when trades go against you, while take-profit levels allow traders to lock in profits at predefined levels.
These tools provide a safety net in volatile markets. Managing risk also involves calculating risk-to-reward ratios to ensure that the potential gains outweigh the potential losses.
Popular Swing Trading Strategies

Momentum-based trading is one of the most common strategies used by swing traders. This strategy involves identifying assets that are experiencing strong momentum, either upward or downward, and riding that momentum for a period.
Momentum indicators like the Moving Average Convergence Divergence (MACD) or the RSI are typically used to confirm that an asset is in a trending phase. By entering a position when momentum is strong, traders seek to capitalise on large price movements.
Another widely used swing trading strategy is the breakout strategy. Breakouts occur when the price moves beyond a well-established support or resistance level. This movement often signals the start of a new trend.
Traders use technical analysis tools like trend lines and horizontal levels to identify these key price points. Once a breakout occurs, they enter trades with the expectation that the trend will continue in the breakout direction.
Key Swing Trading Indicators and Tools

Swing traders rely heavily on technical indicators to inform their decisions. Moving averages, both simple (SMA) and exponential (EMA), are two of the most important tools for identifying trends.
A moving average smooths out price fluctuations and highlights the underlying trend. The crossover of a short-term moving average over a long-term moving average is often used as a signal to enter a trade.
The Relative Strength Index (RSI) is another popular tool in swing trading. The RSI is an oscillator that measures the magnitude of recent price changes to evaluate overbought or oversold conditions in a market.
A reading above 70 typically indicates that an asset is overbought, while a reading below 30 suggests that it is oversold. These signals can help traders anticipate price reversals.
Bollinger Bands are useful for measuring volatility. These bands expand and contract based on market conditions, with the price moving between the upper and lower bands. When the price breaks through the upper or lower band, it often signals that the market is overextended, which can be a cue for reversal or a continuation.
Conclusion
Swing trading is a dynamic and rewarding strategy for active traders who are seeking to profit from short to medium-term price movements. By understanding key concepts such as technical analysis, momentum, and market psychology, traders can develop strategies tailored to their trading style.
Through effective risk management, disciplined decision-making, and constant learning, swing traders can navigate the complexities of the market and achieve long-term success.


