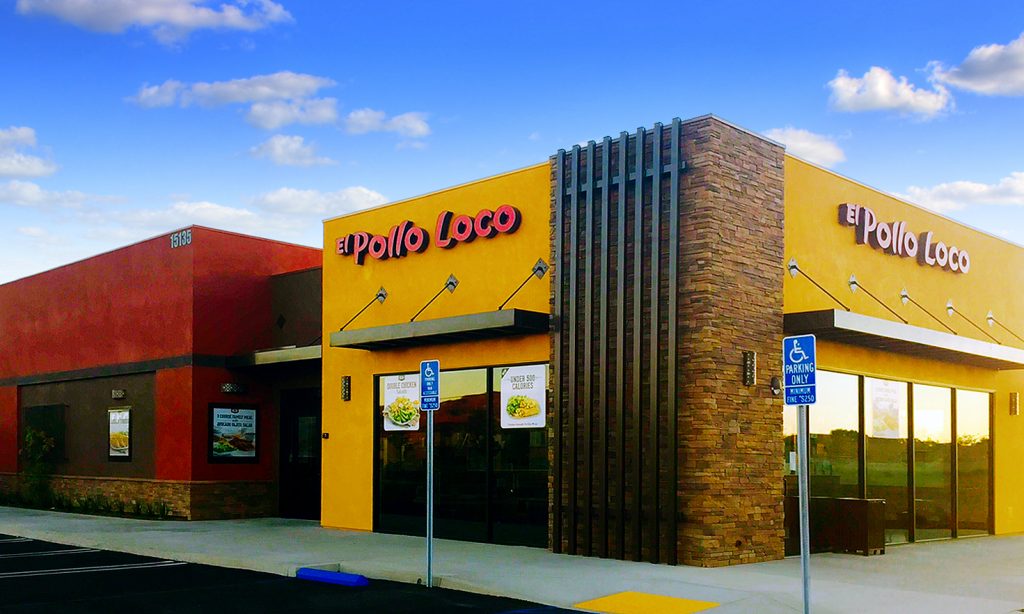
El Pollo Loco Holdings, Inc., through its wholly-owned subsidiary, El Pollo Loco, Inc., develops, franchises, licenses, and operates quick-service restaurants under the El Pollo Loco name in the United States. As of July 17, 2017, it had approximately 470 company-owned and franchised restaurants in Arizona, California, Nevada, Texas, and Utah. The company was formerly known as Chicken Acquisition Corp. and changed its name to El Pollo Loco Holdings, Inc. in April 2014. El Pollo Loco Holdings, Inc. was founded in 1980 and is headquartered in Costa Mesa, California.
BUSINESS ANALYSIS OF EL POLLO LOCO HOLDINGS
The Restaurants Sector is witnessing a major shakeup, new age business models in the industry are transforming both customers and businesses. Faced with this uncertainity, companies are investing resources to transform their business. An in-depth business analysis is a valuable resource to identify and articulate the need for a business model change. At R&P Research we believe, the starting point for a business analysis is Benchmarking. Business benchmarking can be done at various levels: 1) Industry Benchmarking 2) Peer Benchmarking 3) Disruptors Benchmarking. In this report, we share the snapshot of how El Pollo Loco Holdings compares against the industry on the major performance indicators. This analysis, along with peer group/disruptors benchmarking and revenue model understanding can help identify growth and cost optimization opportunities to maximize the value delivered by El Pollo Loco Holdings to its stakeholders. R&P Research Industry Intelligence Platform provides historical data for last 15 years with an easy to use benchmarking interface for an in-depth comparative business analysis.
- Revenue Growth: El Pollo Loco Holdings reported a revenue growth of 7.1% year-on-year during 2016. Fast-Casual Restaurants Industry grew at -5.8% in the same period
- COGS share of Revenues: As a percentage of revenue, El Pollo Loco Holdings spent 74.3% of its total revenues on COGS. Fast-Casual Restaurants industry average (COGS share of revenue) in the same period was 81.0%
- R&D; share of Revenues: El Pollo Loco Holdings R&D; share of Revenues details are not available because either company does not share the data or we do not have it
- SG&A; share of Revenues: As a percentage of revenue, El Pollo Loco Holdings spent 9.1% of its total revenues on Sales, Marketing, and General Administration (SG&A;). Fast-Casual Restaurants industry average SG&A; spending in the same period was 11.3%
- Inventory share of Revenues: As a percentage of revenue, El Pollo Loco Holdings spent 0.6% of its total revenues on Inventories. Fast-Casual Restaurants industry average Inventory spending in the same period was 0.6%
- Accounts Payable share of Revenues: As a percentage of revenue, El Pollo Loco Holdings invested 3.1% of its total revenues on Accounts Payable (A/P) Fast-Casual Restaurants industry average Accounts Payable investment in the same period was 2.2%
- Accounts Receivable share of Revenues: As a percentage of revenue, El Pollo Loco Holdings invested 1.8% of its total revenues on Accounts Receivable (A/R). Fast-Casual Restaurants industry average Accounts Receivable investment in the same period was 1.2%
- PP&E; share of Revenues: As a percentage of revenue, El Pollo Loco Holdings invested 31.2% of its total revenues on Property, Plants, and Equipments (PP&E;). Fast-Casual Restaurants industry average PPE investment in the same period was 34.8%
- Intangibles share of Revenues: As a percentage of revenue, El Pollo Loco Holdings invested 81.8% of its total revenues on Intangibles. Fast-Casual Restaurants industry average Intangibles investment in the same period was 10.3%
- Net Margins: El Pollo Loco Holdings Net Margins in the year 2016 were 4.8%. Fast-Casual Restaurants industry average Net Margins in the same period were 0.1%
SECTOR AND INDUSTRY ASSOCIATION OF EL POLLO LOCO HOLDINGS
For the purpose of performance benchmarking of a company with a sector or industry average, R&P; Research associates every company with one sector and one industry. An industry consists of companies with related/similar business models. A sector comprises of a group of related/similar industries.
El Pollo Loco Holdings is associated with Restaurants Sector and Fast-Casual Restaurants Industry.
Restaurants sector is comprised of the following industries: Fast Food Restaurants; Fast-Casual Restaurants; Casual Dining Restaurants; Fine Dining Restaurants. The definitions for each of the industries is as follows:
- Fast Food Restaurants industry includes fast food restaurants. Fast food restaurants are typically chains like McDonalds and Burger King. Fast food restaurants are also known in the restaurant industry as QSRs or quick-service restaurants.
- Fast-Casual Restaurants industry include restaurants that do not offer full table service, but offer a higher quality of food with fewer frozen or processed ingredients than other fast food restaurants. It is an intermediate concept between fast food and casual dining. The category is exemplified by chains such as Noodles & Company, El Pollo Loco Holdings, Inc., and Chipotle Mexican Grill, Inc.
- Casual Dining Restaurants industry includes restaurants that offer table side service, non-disposable dishes at a moderate price. Menu in these restaurants ranges from Italian to seafood to Mexican food.
- Fine Dining Restaurants industry includes restaurants that are full service restaurants with specific dedicated meal courses. Décor of these restaurants features higher-quality materials.
INDUSTRY RANKING OF EL POLLO LOCO HOLDINGS
With $380.1 million revenues, El Pollo Loco Holdings ranked number 4 of all the companies in the US Fast-Casual Restaurants industry. There were a total of 8 public companies in the US Fast-Casual Restaurants industry that had revenues greater than $50 million during 2016.
The top companies in the US Fast-Casual Restaurants industry by revenues during 2016 were:
- Chipotle Mexican Grill ($3.9 billion)
- Fiesta Restaurant Group ($711.8 million)
- Noodles & Company ($487.5 million)
- El Pollo Loco Holdings ($380.1 million)
- Habit Restaurants ($283.8 million)
- Zoe’s Kitchen ($276 million)
- Wingstop ($91.4 million)
- Good Times Restaurants ($64.4 million)
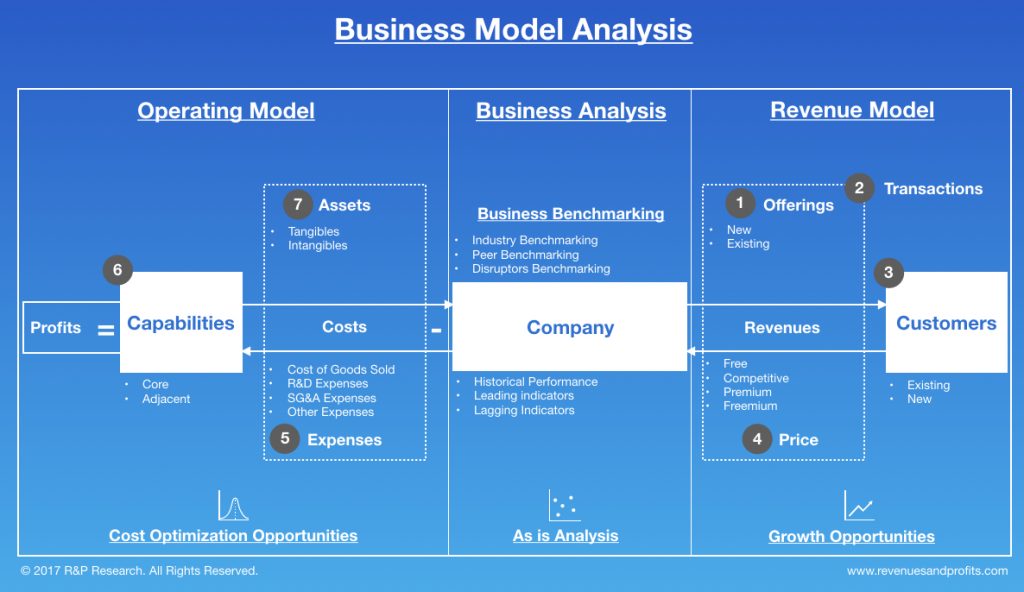
BUSINESS MODEL ANALYSIS (BMA) FRAMEWORK
We use the following framework to assess the business model of a company. Business Model Analysis framework can be used by organizations to articulate growth strategies and identify cost optimization opportunities. Technology and consulting companies can use this framework to identify the value drivers and pain points of their targeted customers. Entrepreneurs can use this framework to understand the language of business and identify promising business opportunities. This framework can be used by any professional aspiring to take up a leadership role to better understand the businesses challenges, articulate growth strategy, and monitor the business improvement requirements for the organization.
NEXT STEPS
- Conduct a holistic benchmarking; to identify and target additional sources of value
- Get in touch with us to learn more about Business Model Analysis Framework
- Get free data, charts, and analysis of El Pollo Loco Holdingsand its peers on select key performance indicators by clicking the reports provided below
INDUSTRY PEERS AND COMPETITORS OF EL-POLLO-LOCO-HOLDINGS
Chipotle Mexican Grill (CMG) Business Analysis – Analyze Historical Performance, Strategic…
Chipotle Mexican Grill Inc with $4 billion revenues in the year 2016 was the number 1 Fast-Casual Restaurants company. Read this report to know the top competitors of Chipotle Mexican Grill and identify growth and cost optimization opportunities of Chipotle Mexican Grill
Fiesta Restaurant Group (FRGI) Business Analysis – Analyze Historical Performance, Strategic…
Fiesta Restaurant Group, Inc. with $712 million revenues in the year 2016 was the number 2 Fast-Casual Restaurants company. Read this report to know the top competitors of Fiesta Restaurant Group and identify growth and cost optimization opportunities of Fiesta Restaurant Group
Noodles & Company (NDLS) Business Analysis – Analyze Historical Performance, Strategic…
Noodles & Company with $487 million revenues in the year 2016 was the number 3 Fast-Casual Restaurants company. Read this report to know the top competitors of Noodles & Company and identify growth and cost optimization opportunities of Noodles & Company
Habit Restaurants (HABT) Business Analysis – Analyze Historical Performance, Strategic Priorities,…
Habit Restaurants, Inc. with $284 million revenues in the year 2016 was the number 5 Fast-Casual Restaurants company. Read this report to know the top competitors of Habit Restaurants and identify growth and cost optimization opportunities of Habit Restaurants
Zoe’s Kitchen (ZOES) Business Analysis – Analyze Historical Performance, Strategic Priorities,…
Zoe’s Kitchen, Inc. with $276 million revenues in the year 2016 was the number 6 Fast-Casual Restaurants company. Read this report to know the top competitors of Zoe’s Kitchen and identify growth and cost optimization opportunities of Zoe’s Kitchen
Wingstop (WING) Business Analysis – Analyze Historical Performance, Strategic Priorities, And…
Wingstop Inc. with $91 million revenues in the year 2016 was the number 7 Fast-Casual Restaurants company. Read this report to know the top competitors of Wingstop and identify growth and cost optimization opportunities of Wingstop
REVENUES ANALYSIS
El Pollo Loco Holdings (LOCO) Revenues And Revenue Growth From 2012…
This report provides the last five years revenues and revenue growth of El Pollo Loco Holdings, Inc. (LOCO) from 2012 to 2016. El Pollo Loco Holdings generated a total of $380.1 million revenues during 2016. El Pollo Loco Holdings reported a revenue growth of 7.1% year-over-year during 2016. The revenues and the revenue growth correspond to the fiscal year ending in December.
El Pollo Loco Holdings (LOCO) Revenue Growth Comparison With Industry Growth…
This report provides a comparison of El Pollo Loco Holdings, Inc. (LOCO) revenue growth with Fast-Casual Restaurants industry growth during the last four years from 2013 to 2016. El Pollo Loco Holdings reported a revenue growth of 7.1% year-over-year during 2016. The Fast-Casual Restaurants industry growth was -5.8% year-over-year during 2016. El Pollo Loco Holdings growth was faster than the industry during 2016.
PROFIT ANALYSIS
El Pollo Loco Holdings (LOCO) Net Profit And Net Margin From…
This report provides the last three years net profit and net margin of El Pollo Loco Holdings, Inc. (LOCO) from 2014 to 2016. El Pollo Loco Holdings reported a total net income of $18.3 million during 2016. El Pollo Loco Holdings generated a total of $380.1 million revenues during 2016. El Pollo Loco Holdings net profit margin was 4.8% during 2016. The net profit and the net profit margin correspond to the fiscal year ending in December.
El Pollo Loco Holdings (LOCO) Net Profit And Net Margin From…
This report provides the last five years net profit and net margin of El Pollo Loco Holdings, Inc. (LOCO) from 2012 to 2016. El Pollo Loco Holdings reported a total net income of $18.3 million during 2016. El Pollo Loco Holdings generated a total of $380.1 million revenues during 2016. El Pollo Loco Holdings net profit margin was 4.8% during 2016. The net profit and the net profit margin correspond to the fiscal year ending in December.
El Pollo Loco Holdings (LOCO) Net Profit Margin Comparison With Industry…
This report provides a comparison of El Pollo Loco Holdings, Inc. (LOCO) net profit margin with Fast-Casual Restaurants industry net profit margin during the last five years from 2012 to 2016. El Pollo Loco Holdings reported a net profit margin of 4.8% during 2016. The Fast-Casual Restaurants industry net profit margin was 0.1% during 2016. El Pollo Loco Holdings was more profitable than the industry during 2016.
COST EXPENSES ANALYSIS
El Pollo Loco Holdings (LOCO) Cost of Sales (COGS) Analysis From…
This report provides the last five years cost of sales (COGS) analysis of El Pollo Loco Holdings, Inc. (LOCO) from 2012 to 2016. El Pollo Loco Holdings spent a total of $282.5 million on COGS during 2016. El Pollo Loco Holdings generated a total of $380.1 million revenues during 2016. As a percentage of revenues, El Pollo Loco Holdings spent 74.3% of its total revenues on COGS during 2016. The cost of sales (COGS) numbers are for the fiscal year ending in December.
El Pollo Loco Holdings (LOCO) Research & Development (R&D) Spending Analysis…
R&D; spending analysis for El Pollo Loco Holdings is not available because either the company does not provide the data or we don’t have it.
El Pollo Loco Holdings (LOCO) Sales, Marketing, General & Administrative (SG&A)…
This report provides the last five years sales, marketing, general & administrative (SG&A;) expenses of El Pollo Loco Holdings, Inc. (LOCO) from 2012 to 2016. El Pollo Loco Holdings spent a total of $34.7 million on sales, marketing, general, and administrative (SG&A;) activities during 2016. El Pollo Loco Holdings generated a total of $380.1 million revenues during 2016. As a percentage of revenues, El Pollo Loco Holdings spent 9.1% of its total revenues on SG&A; activities during 2016. The SG&A; spending numbers are for the fiscal year ending in December.
WORKING CAPITAL ANALYSIS
El Pollo Loco Holdings (LOCO) Inventory Spending Analysis From 2013 To…
This report provides the last four years inventory spending analysis of El Pollo Loco Holdings, Inc. (LOCO) from 2013 to 2016. El Pollo Loco Holdings invested a total of $2.1 million on inventories during 2016. El Pollo Loco Holdings generated a total of $380.1 million revenues during 2016. As a percentage of revenues, El Pollo Loco Holdings invested 0.6% of its total revenues on inventories during 2016. The inventory numbers are for the fiscal year ending in December.
El Pollo Loco Holdings (LOCO) Accounts Receivable (A/R) Analysis From 2013…
This report provides the last four years Accounts Receivable (A/R) analysis of El Pollo Loco Holdings, Inc. (LOCO) from 2013 to 2016. El Pollo Loco Holdings invested a total of $6.9 million on accounts receivable during 2016. El Pollo Loco Holdings generated a total of $380.1 million revenues during 2016. As a percentage of revenues, El Pollo Loco Holdings invested 1.8% of its total revenues on accounts receivable during 2016. The accounts receivable numbers are for the fiscal year ending in December.
El Pollo Loco Holdings (LOCO) Accounts Payable (A/P) Analysis From 2013…
This report provides the last four years Accounts Payable (A/P) analysis of El Pollo Loco Holdings, Inc. (LOCO) from 2013 to 2016. El Pollo Loco Holdings invested a total of $11.6 million on accounts payable during 2016. El Pollo Loco Holdings generated a total of $380.1 million revenues during 2016. As a percentage of revenues, El Pollo Loco Holdings invested 3.1% of its total revenues on accounts payable activities during 2016. The accounts payable numbers are for the fiscal year ending in December.
ASSET MANAGEMENT ANALYSIS
El Pollo Loco Holdings (LOCO) Property, Plant & Equipment (PP&E) Investment…
This report provides the last four years property, plant & equipment (PP&E;) investment analysis of El Pollo Loco Holdings, Inc. (LOCO) from 2013 to 2016. El Pollo Loco Holdings invested a total of $118.5 million on property, plant & equipment (PP&E;) activities during 2016. El Pollo Loco Holdings generated a total of $380.1 million revenues during 2016. As a percentage of revenues, El Pollo Loco Holdings invested 31.2% of its total revenues on PP&E; activities during 2016. The PP&E; investment numbers are for the fiscal year ending in December.
El Pollo Loco Holdings (LOCO) Intangible Assets Analysis From 2013 To…
This report provides the last four years Intangible assets analysis of El Pollo Loco Holdings, Inc. (LOCO) from 2013 to 2016. El Pollo Loco Holdings invested a total of $311 million on Intangible assets during 2016. El Pollo Loco Holdings generated a total of $380.1 million revenues during 2016. As a percentage of revenues, El Pollo Loco Holdings invested 81.8% of its total revenues on intangible assets during 2016. The Intangible asset numbers are for the fiscal year ending in December.

